Defining the Report Format
|
|
You use this
function, together with the function described in Generating a Report, to
get the values of properties of objects in a document. You can also get
related information, such as number of objects. This task shows you
how to define the report format.
Examples from the Piping workbench are used here. Substitute the appropriate resource or directory when working in another workbench. |
|
|
|
Before you generate a
report you need to define its format. This means deciding which properties
you are interested in. This report format is kept in a file which you can
use to generate reports from other documents.
It is recommended that you use queries, as explained below, if you will be modifying a document and running a report on it repeatedly. To use this function .you must first make sure of a setting. Click Tools - Options - General - Parameters and Measure, and click the Knowledge Environment tab. Under Language, check Load extended language libraries. Either check All Packages, or uncheck this option and load the packages you will be using. |
|
|
|
1. | Click Tools - Report -
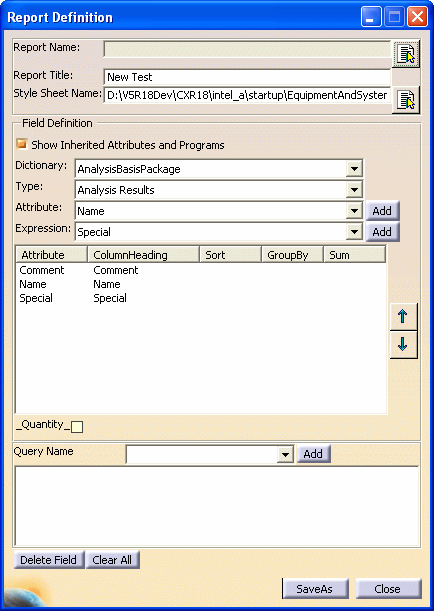
Define. The Report Definition dialog box displays.
You can toggle between Yes and No for the Column headings Sort, GroupBy and Sum. A blank means No. To toggle, click beneath the column heading. The Up and Down arrows on the right allow you to change the position of the attribute in the pane. To use, select an attribute and click an arrow. |
| 2. | Open an existing report by
clicking the button beside the Report
Name field. You can enter a title in the Report Title field. |
|
| 3. | Select a style sheet by clicking
on the button next to the Style Sheet Name field. You can use
sample style sheets provided with this application, modify the samples,
or create your own. NOTE: If you want to use style sheets to change the looks or format of your generated report, then the report must be saved in XML format. You can reference three sample style sheets that are provided with this application to make the output file easier to read. One of the three style sheets also allows you to sort. The style sheets are located in the directory ...intel_a\startup\Equipmentand Systems\ReporterData.
If style sheet information has not been selected in your report format - for instance in formats created using early releases - you can add it to existing reports using the following procedure:
|
|
| 4. | Select the Show Inherited Attributes and Programs checkbox if you want to. | |
| 5. | From the Dictionary
drop-down list, select the dictionary related to your program
See Using Knowledgeware Packages for more information. |
|
| 6. | From the Type
drop-down list, select the the type of object. The list of attributes you see depends on the Type you select here. However, when you generate a report, you get values for all objects in the documents that have the attributes included in your report format. If you want to limit the objects on a report, you must create a query. |
|
| 7. | Select an attribute in the
Attribute drop-down list, and click the Add button.
The attribute displays in the pane under Attribute. Add as many attributes as you want to by repeating the process. Attributes are added one at a time. |
|
| 8. | Select an expression from the
Expression drop-down list, and click the Add button.
(For more information on creating expressions, see
Managing Knowledgeware Expressions.) The expression name displays in the pane under Attribute. Add as many expressions as required by repeating the process. Expressions are added one at a time. These user-created expressions are saved in the PRM defined directory. Adding an expression to a report definition template is the same as adding an attribute to a report definition template. The expression name is used to fill in the Attribute and ColumnHeading fields. The other fields, Sort, Group By and Sum also apply to Expressions. See below. |
|
| 9. | Click beneath the column headings
(Sort, GroupBy
and Sum) to toggle between Yes and No. A
blank represents No.
The Up and Down arrows on the right allow you to change the position of the attribute in the pane. To use, select an attribute and click an arrow.
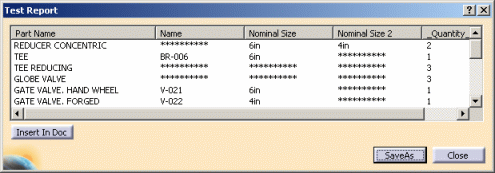
If the objects you group have attributes that have unique values, then the values will be replaced by asterisks. For instance, Globe Valves in the report above, have three unique names, therefore the Name field shows asterisks. |
|
| 10. |
To use a query you have already defined, click the down arrow next to the
Query Name field and select it. Click the Add
button to display it in the pane. There is more explanation about
queries below.
You can further refine your report by using the Edit - Search function to define a query. This will allow you to generate a report on a narrower selection of check valve, say, of a certain size, instead of all check valves in your document. The queries you create will be available for selection when you click the arrow in the Query Name field above. Detailed instructions on using the Search function can be found in the Infrastructure User Guide under Basic Tasks - Selecting Objects. Briefly, click Edit - Search to bring up the Search dialog box. Select the Advanced tab, then select a workbench, type of object and attribute you are interested in. Clicking the Add to Favorites button brings up the Create a Favorite Query dialog box, where you can name the query and save it. |
|
| 11. | Use the Delete Field button to clear any of the entries, Clear All to remove all, SaveAs to save, and Close to exit the command. | |
![]()


