This task will show you how to activate an image and how to edit an image.
You can generate an image in addition to those of the Image toolbar (using the Image Generation dialog box). The list of these images will depend on the Case type. You will then be able to edit different types of images that by default appear in the Image Generation dialog box.
In other words, the names of the images depend on:
- physical type (for example: Displacement)
- visualization type (for example: Symbol or Text)
- criterion (for example: Vector or Principal value)
Open the
sample26.CATAnalysis document from the samples directory.
In this particular example, Von Mises Stress (nodal values)
images are already created and deactivated.
Activating an Image
You cannot activate an image belonging to an analysis case
which is not the current one.
To know more about the current case, refer to
Changing a Current Analysis Case.
To activate an image:
-
Right-click the image you want to activate.
-
Select Activate/Deactivate
 .
.-
An updated entity: the image is activated.
-
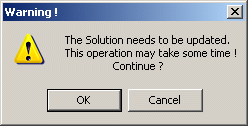
A non updated entity: a warning message appears to inform you that the entity needs to be updated.
In this particular example, the entity is a solution. An entity can also be a mesh part, a preprocessing set, ...

-
OK: if you click this button the computation is launched to update the solution and so the image is activated.
-
Cancel: if you click this button the image is still deactivated.
-
-
Editing an Image
Open the sample00.CATAnalysis document from the samples directory.
In this particular example, you have to generate images using the Generate Image contextual menu or using the Images toolbar.
-
Double-click an image in the specification tree.
If the image you double-click is:
-
Activated: the Image Edition dialog box appears.
For more details about the Image Edition dialog box, refer to Image Edition. -
Deactivated: the activation process is launched.
-
-
Set the desired parameters in the Image Edition dialog box.
-
Click OK.
In case of pre-processing specifications, the type of
entities contained in a selection may be different from a specification to
another.
For example:
-
a Clamp symbolizes a list of nodes
-
a Lineic Force symbolizes a list of edges
-
a Pressure symbolizes a list of faces
You can find an example:
-
Open the sample49_2.CATAnalysis from the samples directory.
-
Double-click the Clamp.1 object in the specification tree.
You can see that the support of the clamp is one face.
You can close the Clamp dialog box. -
Right-click the Von Mises Stress (nodal values) image in the specification tree and select Activate/Deactivate.
-
Double-click the Von Mises Stress (nodal values) image in the specification tree to edit it.
-
Select the Selections tab.
-
Select Clamp.1.
You can visualize nodes:

-
Select Surface Group.1.
