
|
|
When an interference is associated to an experiment (i.e., as a sensor), the sensor value: |
 |
|
represents either:
|
|
| Therefore, the sensor value is meaningful only if the During Initial Computation value is set as described above. | |
| When you alter During Initial Computation value, you may get the following message. | |
 |
|
| This message informs you that the value of the Numeric Result option has been changed automatically to correspond to that of During Initial Computation. Depending on your needs, you may wish to return the Numeric Result option to its initial state when you have finished the experiment. |
-
In the specification tree, select Sequence.4.
-
Click Edit and Perform Experiment
 on the DMU Simulation toolbar.
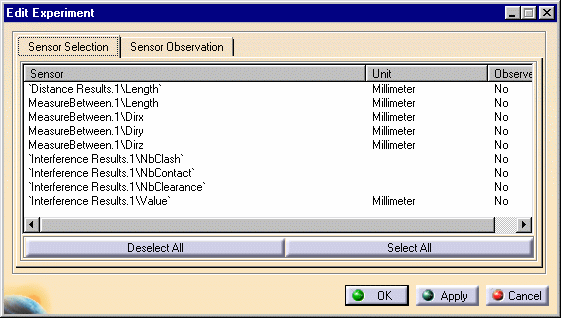
An Experiment object appears in the specification tree, and the Edit Experiment dialog box and Player pop-up toolbar appear. 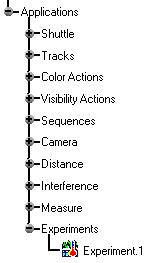
Player toolbar

-
Select the sensors to be observed; for this exercise, click the Select All button.
-
Click the Sensor Observation tab and play your sequence using the Player buttons:
The sensors are logged as the sequence simulation is playing. 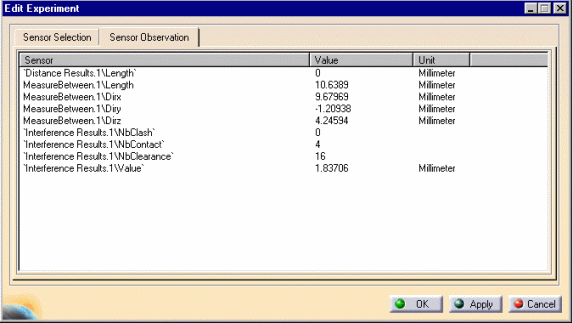
-
On the Player pop-up toolbar, move the slider to the starting point (far left), which returns the geometry to its position prior to running the sequence.
-
Click Apply in the Edit Experiment dialog box.
The Save As dialog box is displayed -
Enter a meaningful name (e.g., Simulation report), and select a path.
You are going to generate a simulation report, which is going to be a design table. -
Select either the txt or xls format from the Save As type list.
For this exercise, select xls. -
Click Save in the Save As dialog box
The progress bar is displayed letting you monitor and, if necessary, interrupt (by clicking Cancel) the calculation. 
The sequence is simulated. The Browse Experiment dialog box is displayed. 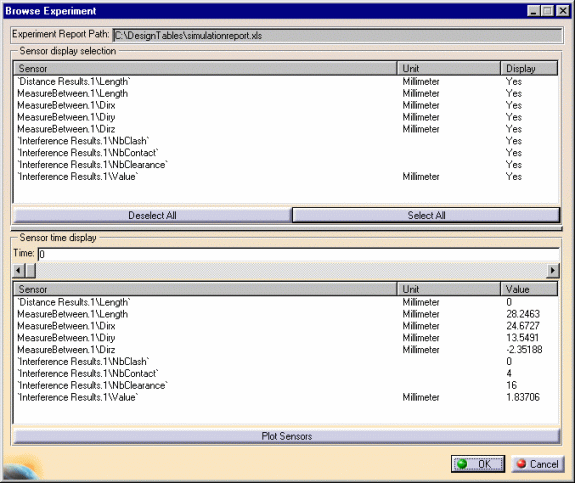
-
Click the Select All button to select all sensors for observation.
The Sensor time display area of the dialog box part lets you refine your analysis. -
Use the slider or enter a precise value in the Time field if you want to check one particular shot.
The values are updated accordingly. (See image above) -
Click the Plot Sensors button to display a graphical representation of the simulation report generated for experiment.1.
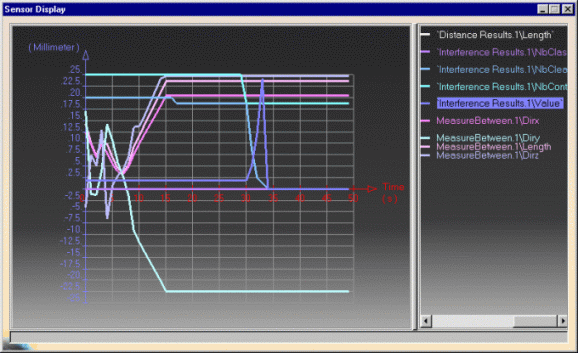
-
Open your simulation report
This is what you obtain: 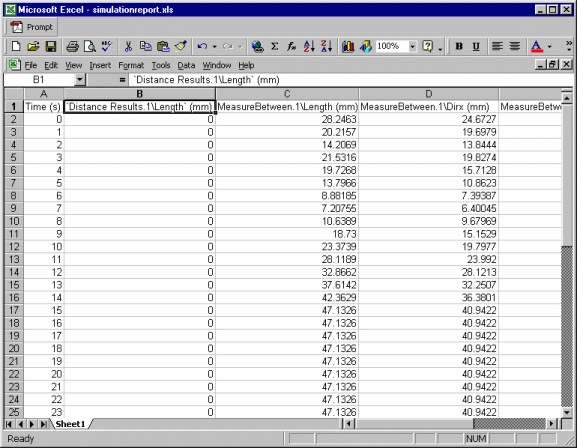

If you delete the design table created (our simulationreport.xls) in our example, the next time you open your document, the experiment is empty.
About Experiments and Simulation Reports
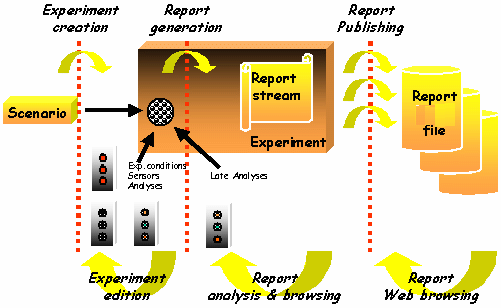
A new object called Experiment is created and displayed in the
specification tree when clicking the Edit and Perform Experiment ![]() from the DMU Simulation toolbar.
from the DMU Simulation toolbar.
How Does It Work?
- One scenario is associated with the experiment at creation: scenarios are all objects that can be simulated using the Player (e.g., Sequence, Track, and Simulation)
- None or several sensors are associated as outputs from the experiment; each is then set as observed if its values versus time must be traced in the report of simulation
Experiment Report Generation
- Report generation is a one-shot operation, where observed sensors are traced versus time, while the simulation is proceeding.
- Report is an object aggregated to the Experiment as a design table (Knowledgeware component).
![]()