A Gantt chart is bar graph of a sequence. It shows start and stop times as well as dependencies. The Gantt chart is a 2D view of the sequence process.
-
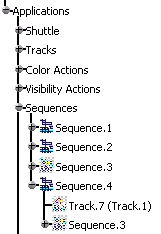
Select a sequence in the specification tree, e.g., Sequence.4.


You cannot see multiple sequences in a single Gantt chart. -
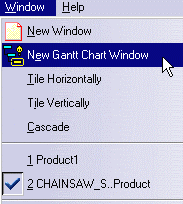
Select Window > New Gantt Chart Window.

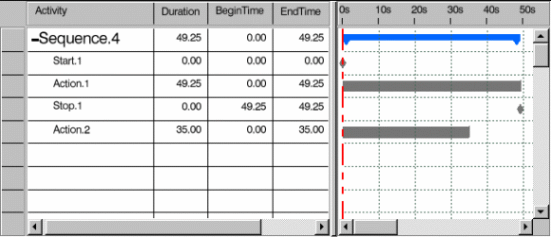
The Gantt chart window is displayed: 
- The left frame of the Gantt chart lists each of the individual
actions and /or analyses that exist in your document, displaying
the duration, start time, and end time for each.
- The right frame provides a graphical representation of each
action or analysis (along the line of time), and also indicates the
start, duration and end of each.
- A dashed vertical line in the right window (called the Time Line), provides a visual indication of the current time during the execution.
- The left frame of the Gantt chart lists each of the individual
actions and /or analyses that exist in your document, displaying
the duration, start time, and end time for each.
-
Click OK on the Edit Sequence dialog box and close the Gantt chart viewer.
Altering the Duration of an Action
-
On the specification tree, double-click on a sequence.
The Edit Sequence dialog box appears. -
Select Window > New Gantt Chart Window.
The Gantt chart window appears. -
Alter the duration of the track by stretching the graphical representation on the right side of the Gantt chart.
The duration shown in the Edit Sequence dialog box takes on the new value. -
Alter the duration of the track by changing the duration within the Action duration field of the Edit Sequence dialog box.
The duration shown in the Gantt chart takes on the new value.