- Simulation time
When the end user is running a simulation. - Simulation event
When the end user is moving the device with forward/inverse kinematics through Teach/Jog commands.
-
Click Data Readout
 .
.The Options toolbar appears; Display  appears highlighted by default.
-
Click Sensors
 .
. -
(Optional) Click Display
 (both Display
  and Sensors
 can run simultaneously, but it is not necessary to leave Display
  on while running Sensors
  ).
). -
Select the item (i.e., robot or manikin) about which you wish to receive sensor data.
The Sensor Management dialog box appears, listing the sensors available for the object. By default, the sensors are not observed; if, however, you have previously selected sensors from that product for observation, they are listed as observed. 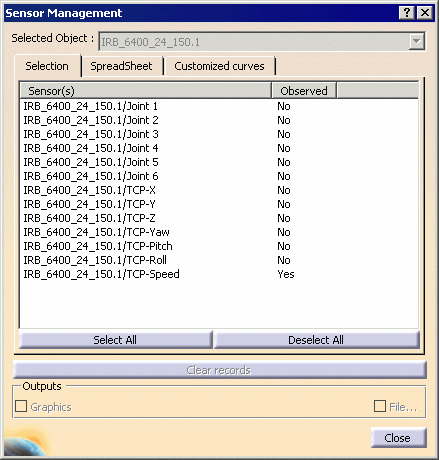
-
Select the sensors you want observed.
-
Run the simulation.

See Using Data Readout for information on using Data Readout  with Process Simulation
-
Do you want to see the data on a spreadsheet or in a graphic format?
Select the data format you want to see: - Graphics format
- Spreadsheet (separate from Spreadsheet tab)
- Data as it appears on the Spreadsheet tab
- Custom Curve tab
-
Select the Graphics check box.
A window is displayed containing the graph: 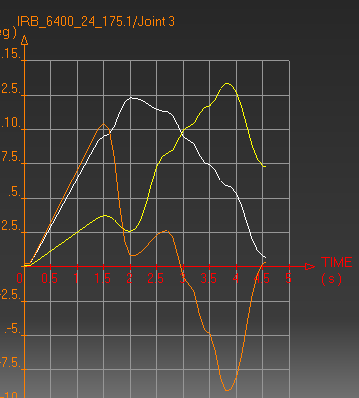
The right side of the window consists of an explanation of the graph, showing which color represents which segment of the device is selected: 
-
Select the File check box.
A Save As dialog box appears. -
Navigate to the directory where you want the file stored, provide a name for the file, and click on the Save button.

On all systems, you can elect to have your data stored in a .txt file. In that case, the data consists of a table with tabs between the columns. On Windows systems, you can elect to have your data stored in an Excel spreadsheet. -
Select the SpreadSheet tab on the Sensor Management dialog box.
You can see the data for each sensor. These data are all the values of the simulation state for each simulation step. 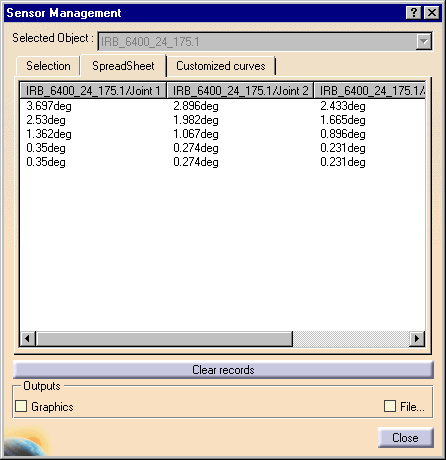
-
Select the Customized curves tab and select the Graphics check box (if it is not already selected).

Using the Customized curves tab, the user can also define specific curves that show the evolution of one sensor related to another one. Customized curves can only be defined between two sensors that are on. -
Click the Add button.
A default name appears (e.g., New Curve.2). 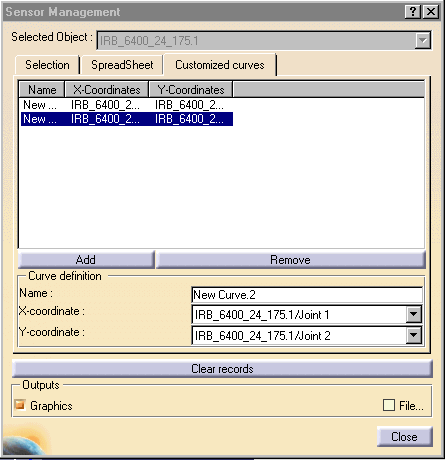
-
Accept the name or edit the given name so that it reflects your needs.
-
From the lists for X-coordinate and Y-coordinate, specify the coordinates.
A new graphic window appears. 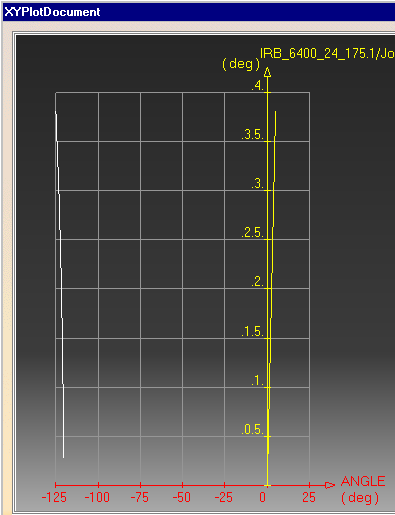

You may leave the box up throughout the simulation. To close a box during or after the simulation, click on the X (close) button in the upper right hand corner.