This task will show you how to use the analysis impact graph. The analysis impact graph allows you to visualize the exposure of dependency links in ENOVIA V5.
The analysis graph depends on the save mode of the pointed product (Workpackage mode or Explode mode).
You will see here how to use the Impacted by and Impacts on functionalities in an analysis document pointing a:
For more details about the impact graph, refer to the VPM Navigator User's Guide.
Analysis Document Pointing a .CATPart File
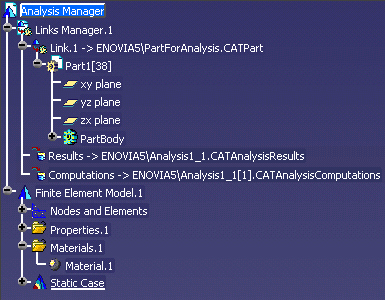
In the specification tree, you will find a CATAnalysis links to a CATPart document, a CATAnalysisResults file and a CATAnalysisComputations file:

The analysis impact graphs looks like this:

All the dependency links between analysis documents and
parts, results and computations documents are valid.
The type of these links is document-to-document.
To create an analysis on part document from an existing one, you have to:
-
Create a new part from the existing one using the Copy and Paste Special - Break Link functionalities.
-
Create a new analysis using the Save Management functionality.
-
Replace the loaded part using the Edit > Links functionality.
![]()
Analysis Document Pointing to a .CATProduct File Saved in Workpackage Mode
In this case, the analysis document points to a product saved in Workpackage mode. This product points to two parts.
The analysis impact graph looks like this:

The type of these links is document-to-document.
![]()
Analysis Document Pointing to a .CATProduct File Saved in Explode Mode
In this case, the analysis document points to a product saved in Explode mode. This product points to two parts.
The analysis impact graph looks like this:

Note that you can visualize the part instance. The type of these links is document-to-instance.
![]()