For a quicker access, this action consists of a toggle made of two icons
You can hide/show this toolbar using the View>Toolbars menu.
-
Click Apply Geometrical Display
 in the Generic Tools toolbar.
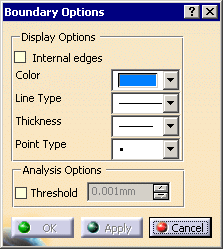
The Geometry of Boundary dialog box appears.
-
Select the part. The selected surfaces are highlighted in orange.
Click Apply to display the boundary(ies).-
By default, the Internal edges check box is not selected,
the geometry of the boundary(ies) of the surface(s) appears.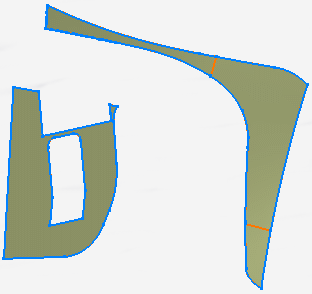
-
If you select the Internal edges check box, the geometry of the boundary(ies) of the faces appears.
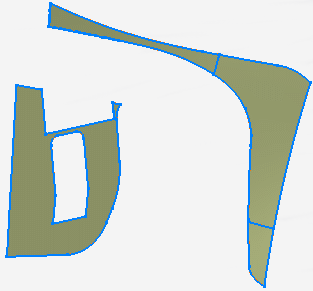
-
-
By default, the boundary(ies) appears as blue lines and points.
You can change the color of the lines and points, the type and thickness of the lines and the symbol of
the points using the Color, Line Type, Thickness and Point Type lists.
Click Apply to take your modifications into account. -
To analyze the boundary, select the Threshold check box, enter a threshold value and click Apply.
-
If the distance between two consecutive
curves is less than this threshold value,
there is no discontinuity in the boundary. -
If the distance between two consecutive
curves is higher than this threshold value,
there is a discontinuity.
An red information flag appears with the value of the distance.
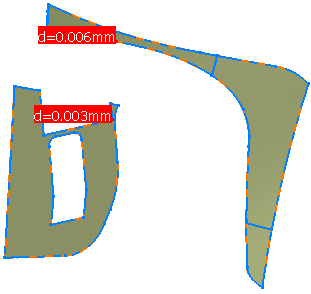
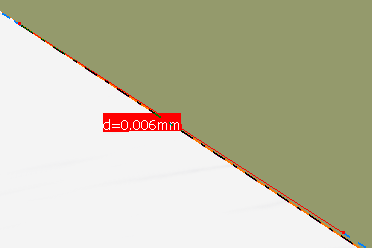
The discontinuity appears as a red line between the closest extremities of two consecutive curves,
with points representing those extremities.
The lower right corner of the red flag is positioned in the middle of the red line. -
If the distance between two consecutive
curves is less than this threshold value,
-
Click Cancel to exit the action and erase the temporary display of the boundary geometry.
Click OK to display permanently the boundary of the selected surfaces. -
To remove the geometrical display, click Remove Geometrical Display
 and
and
select the surfaces on which you want to erase the display. -
Click Remove Geometrical Display
 again to exit the action.
![]()