What is the difference between Hide/Show
and Activate/Deactivate?
- The Hide/Show contextual menu allows you to move the
selected element to the invisible space.

Note that you can visualize and modify elements you have hidden (using the Hide/Show contextual menu) in the invisible space (as a second workspace).
To work in the invisible space and display the hidden elements, click Swap Visible Space .
. - The Activate/Deactivate contextual
menu
 allows you to destroy the screen representation of the selected element
and to regenerate its screen representation later.
This functionality is useful with a large size model to improve your computer performance.
How do you visualize the mesh?
You can visualize:
-
mesh, if you are working with the Nodes and Elements set
-
deformed mesh, if you are working with an Analysis Case set
Visualizing Mesh
-
Launch the computation.
To do this, click the Compute icon, select the Mesh only option and click OK in the Compute dialog box.

For more information, refer to Results Computation.
-
Right-click the Nodes and Elements set from the specification tree and select Mesh Visualization.
|
|
If you select the Mesh Visualization
contextual menu before the computation, a warning message appears to
inform you that the mesh needs to be updated. If you decide to update the mesh, a mesh only computation is launched. |
Visualizing Deformed Mesh
-
Launch the computation.
To do this, click the Compute icon, select the All option and click OK in the Compute dialog box.

For more information, refer to Results Computation.
-
Generate a Deformed Mesh image on the part.
For more information, refer to Visualizing Deformations.
What are the authorized positions according to a visualization type?
The authorized positions depend on the representation type:
VISU Type |
Node Position |
Element Position |
|||||
|
Node |
Edge of element |
Face of element |
Element |
Gauss point of element |
Center of element |
Node of element |
|
|
Average iso |
|
|
|
|
|
|
|
|
Discontinuous iso |
|
|
|
|
|
|
|
|
Fringe |
|
|
|
|
|
|
|
|
Symbol |
|
|
|
|
|
|
|
|
Text |
|
|
|
|
|
|
|
The solver process gives results only for certain positions
that are not always authorized or really useful.
Results need to be post-treated.
The post-treatment can be either a smoothing (element to node) or an extrapolation (node to element).
|
|
For a smoothing post-treatment, the way of computing average values changed according to the different versions of CATIA:
|
How are Von Mises Stress computed?
You can obtain a Von Mises Stress (nodal values) image using the:
-
Dedicated icon.
To do this, click Von Mises Stress
 in the Image toolbar.
-
Image edition (only available with the ELFINI Structural Analysis (EST) product).
-
Click Principal Stress
 .
.
-
Double-click the Stress principal tensor symbol.1 image in the specification tree
-
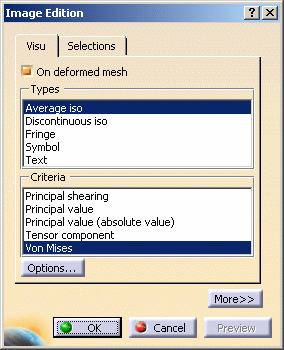
Select the Average iso visualization type and then the Von Mises criteria in the Image Edition dialog box:

-
Click OK in the Image Edition dialog box.

-
The Von Mises Stress (nodal values) values displayed using the Von Mises Stress icon and the Stress Von Mises (nodal values) values displayed from the edition of the Stress principal tensor symbol image can locally produce different results due to two computation modes:
-
In the first case (icon), the solver computation gives directly the result and then the post-processing performs a smoothing (element to node).
-
In the second case (edit), the solver calculates the principal stress tensor, then the post-processing performs a smoothing (element to node), diagonalizes the matrix, and calculates values using the following formula:
 where
where
 ,
,
 and
and
 are the principal stresses.
The first method requires less time and less performance.
How are local extrema computed?
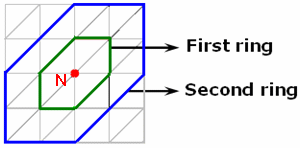
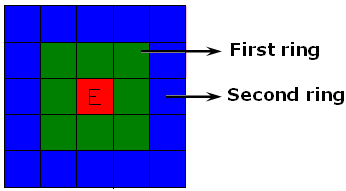
A node (or an element) is a local extrema if it is an extrema compared to the nodes (or elements) belonging to the two rings. The maximum local extrema are sorted in descending order. The minimum local extrema are sorted in ascending order. These rings are defined as follow:
-
For a node:
-
For an element:

