-
In the Definition area, click the Type
drop-down list box and select Band analysis. The Minimum and
Maximum distance are no longer grayed out.
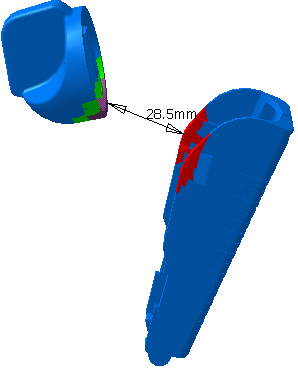
The green area on A corresponds to all the points on A
for which the minimum distance to B is within the user-defined minimum
and maximum distance.
The red area on A corresponds to all the points on A for
which the minimum distance to B is less than the user-defined minimum
distance.
-
Set the Minimum and Maximum distance to define the band
width, to 32 and 36mm respectively for example
 Default values are 1 and 2mm respectively
-
If necessary, set accuracy.
The value entered defines the maximum value for the
length of the longest side of a triangular representation of the results.
This representation is used to obtain the red and green surfaces.
A lower value will give you a more accurate result.
 The default value is 5mm. The minimum value to be accepted is 0.1mm (or
in Inches
0.0039). If you enter a value strictly lower than the minimum value, a
warning message is displayed:
-
Click Apply.A
progress bar is displayed letting you monitor and, if necessary,
interrupt (Cancel option) the calculation.
The preview window is displayed:
Green surfaces identify the areas where the minimum
distance between the products is within the specified range.
Red surfaces identify the areas where the minimum
distance between the products is less than the specified minimum
distance.
The Edit Distance
and Band Analysis dialog box expands to include filters letting you
better visualize the green and red surfaces.
The Export As
 letting you save band analysis results in a variety of different formats
becomes available.
-
Set the appropriate options to show, hide or make
transparent the green and red surfaces corresponding to band analysis
results for components in selection 1. In our example, we set
Selection 1 Results (the Trigger) in green to Hide.
-
Repeat for other components, i.e. those measured against
selection 1. In our example, we set Other Selection Results
(the Regulation_Command) in red to Transparent.
-
Click Apply Filters to visualize the results.
|

|
|
 |
In the Inside one selection computation
type, visualization filters are valid where two products only are
selected. |
-
Close the
Preview window and open a
dedicated results window. A Products drop-down box lets you choose
whether or not to display the products in either or both selections, or
make them transparent. This option is only available in the results
window.
-
Set the drop-down box to Hide/Hide to visualize the
results of the band analysis only.
-
Click OK in the Edit Distance and Band
Analysis dialog box when done.
The band analysis definition and results are kept as a
specification tree feature. This means you can run the measurement again
after, for example, moving one of the products or modifying the contents
of a group: distance results will be updated to reflect changes made.
![]()