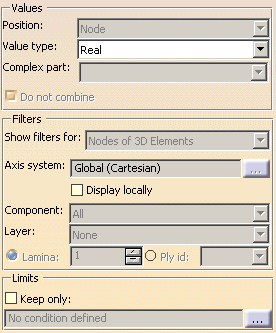
This task describes the advanced edition of the values that are taken into account for the visualization (advanced edition of images) or for the local sensors.
Values
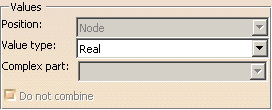
- Position: the position depends
on the selected Type and Criteria option in the
Visu tab.

Node
Linked to the mesh nodes.
For each node, there is only one value.
It is possible to have more than one value in case of tensor images.
If a node is shared by two elements with different dimensions (for example, 1D-dimensional and 3D-dimensional elements), you will get two values since the tensor is different between the two elements.Node of element
For each node, there is as many values as elements linked to this node.
Center of element
For each element center, there is only one value.
Edge of element
For each edge element, there is only one value.
Face of element
For each face element, there is only one value.
Element
For each element, there is only one value.
Gauss point of element
The position of the Gauss points depend on the type of element.
For more details, refer to the Finite Element Reference Manual."(from solver)" indicates that the position is provided by the solver.
To know more about the authorized position according to a selected Visu Type, refer to the Frequently Asked Section - Post-Processing and Visualization section of the Generative Structural Analysis User's Guide.
- Value type: corresponds to the type of the value (integer, real, double precision, complex, complex with double precision).
- Complex part: the complex part
is available when the selected Value Type is complex and complex
with double precision.

- Do not combine:
- if this option is not selected, combined values will be displayed whenever available. The desired resulting force will be displayed.
- if this option is selected, each specification (force, restraints
and so forth) can be displayed separately. You will use the Value
set list box to choose the desired value set.
For example, if three forces were applied on a single surface, three values will be available in the Value set combo box. You can then select the desired Value set.
Filters
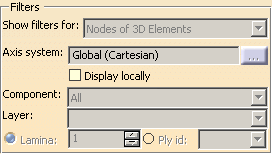
- Show filters for: lets you select
the entity type on which you will change the Axis System,
Component, Layer,
Lamina and Ply id options.

The Show filters for option does not modify the feature you are editing.
The following options are available:
- Nodes of 1D elements, Nodes of 2D elements or Nodes of 3D elements for a Node position type.
- 1D elements, 2D elements or 3D elements
for an Element position type.
- Axis System: lets you select the
current axis system to be used.
To do this, click the ... button.
-
The Axis system functionality is only available if you installed the ELFINI Structural Analysis (EST) product.
-
The ... button is only available if you have selected Vector, Tensor, Vector component or Tensor component as Criteria option.
- Global: lets you select the main axis system.
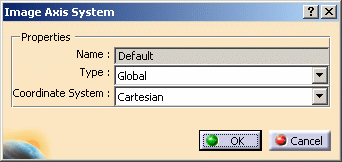
- User: lets you select an axis system feature (created
in the Part Design workbench or the Generative Shape
Design workbench).
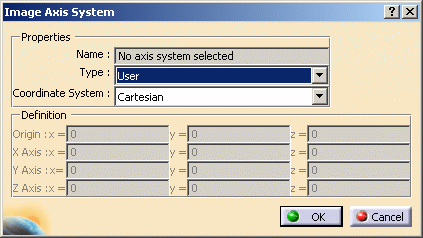
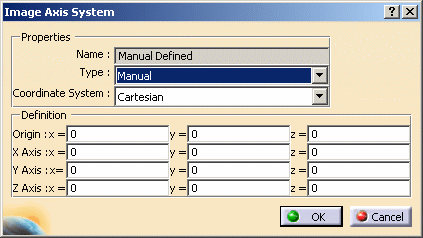
- Manual: lets you specify an axis system by defining
the origin coordinates and the different directions.
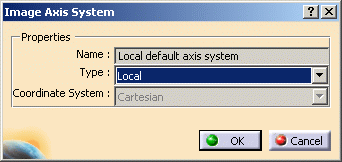
- Local: lets you select an axis system that is locally
defined (related to a finite element).
-
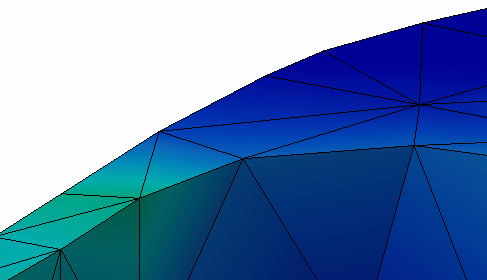
- Display locally: lets you
visualize the axis on each entity.

The Display locally functionality is only available
-
if you installed the ELFINI Structural Analysis (EST) product.
-
in the image edition context.
-
Display locally option deactivated with a Global axis system
-
Display locally option activated with a Global axis system
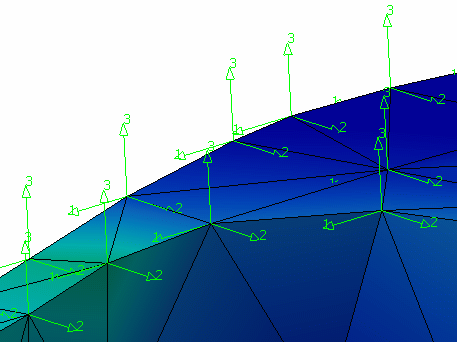
-
- Component: lets you select the
component to visualize.
-
For example, if you select a Translational displacement symbol image, you will get the following Component options:
-
ALL: all the components
C1: components according to x in the current axis system
C2: components according to y in the current axis system
C3: components according to z in the current axis system
You can also have a combination of these components (for example, C1 & C2).
-
-
For Stress principal tensors image:
-
In the case of 3D elements:
C11: is the maximum principal stress
C22: is the middle principal stress
C33: is the minimum principal stress
You can also have a combination of these components (for example, C11 & C22). -
In the case of 2D elements:
C11: is the maximum principal stress
C22: is the minimum principal stress
-

If the components selected for 1D, 2D and 3D elements are different, the All option will be empty to show you that the selected components are not equal.
-
- Layer: (only available in the case
of 2D elements).
For 2D composite properties, the Layer option is available only if the composite property has been defined with the Zone approach (for more details, refer to Generative Structural Analysis User's Guide - User Tasks - Model Manager - Importing Composite Properties).
In this case, the Upper, Middle or Lower options correspond to the top, the middle and the bottom of the stacking.
If the Ply option has been selected during the composite property creation, then the Layer option is not available.
If you installed the ELFINI Structural Analysis (EST) product, you can display both the upper and lower layers according to local normal orientation using the Upper and lower option.
- Lamina: lets you select the lamina
on which you want to visualize the results.

- This option is only available for 2D elements with a composite property.
- This option is not available if you selected Sum as Criteria option in the Visu tab.
- Ply id: lets you select the ply
that you want to visualize and lets you identify each ply independently.

This option is available only for 2D elements with a composite property defined by plies (see Generative Structural Analysis User's Guide - User Tasks - Model Manager - Importing Composite Properties) or with an inhomogeneous composite property (see Generative Structural Analysis User's Guide - User Tasks - Model Manager - XML Mapping Properties).
|
|
The computation is based on the order given by the Lamina option and not on the order given by the Ply id option. The Ply id option is not aimed to visualize the exact way the stacking has been defined. To visualize what happens physically when you perform a core sampling, you have to use the Lamina option. This is an example of a composite stack-up:
|
Limits

If you do not select this check box, all the values of the image are kept. If you select this option, you have to specify a threshold value and a condition according to which the values shown in the image should be filtered.
|
|
This option is available only for scalar and vector mathematical values and only in the image edition context. |
The values displayed in the color palette does not correspond to the exact values (Display Format options in the Color Map edition dialog box).
